Testing a fit’s convergence
If you’d like an in-depth look at how well a fit has converged,
the fastest way is to run a fit from the terminal
(see the Quickstart)
and set diag_plot=True in your .json parameter file.
This produces a diagnostic figure that, using the fit to the DSHARP observations
of AS 209 from the Quickstart, looks like this,
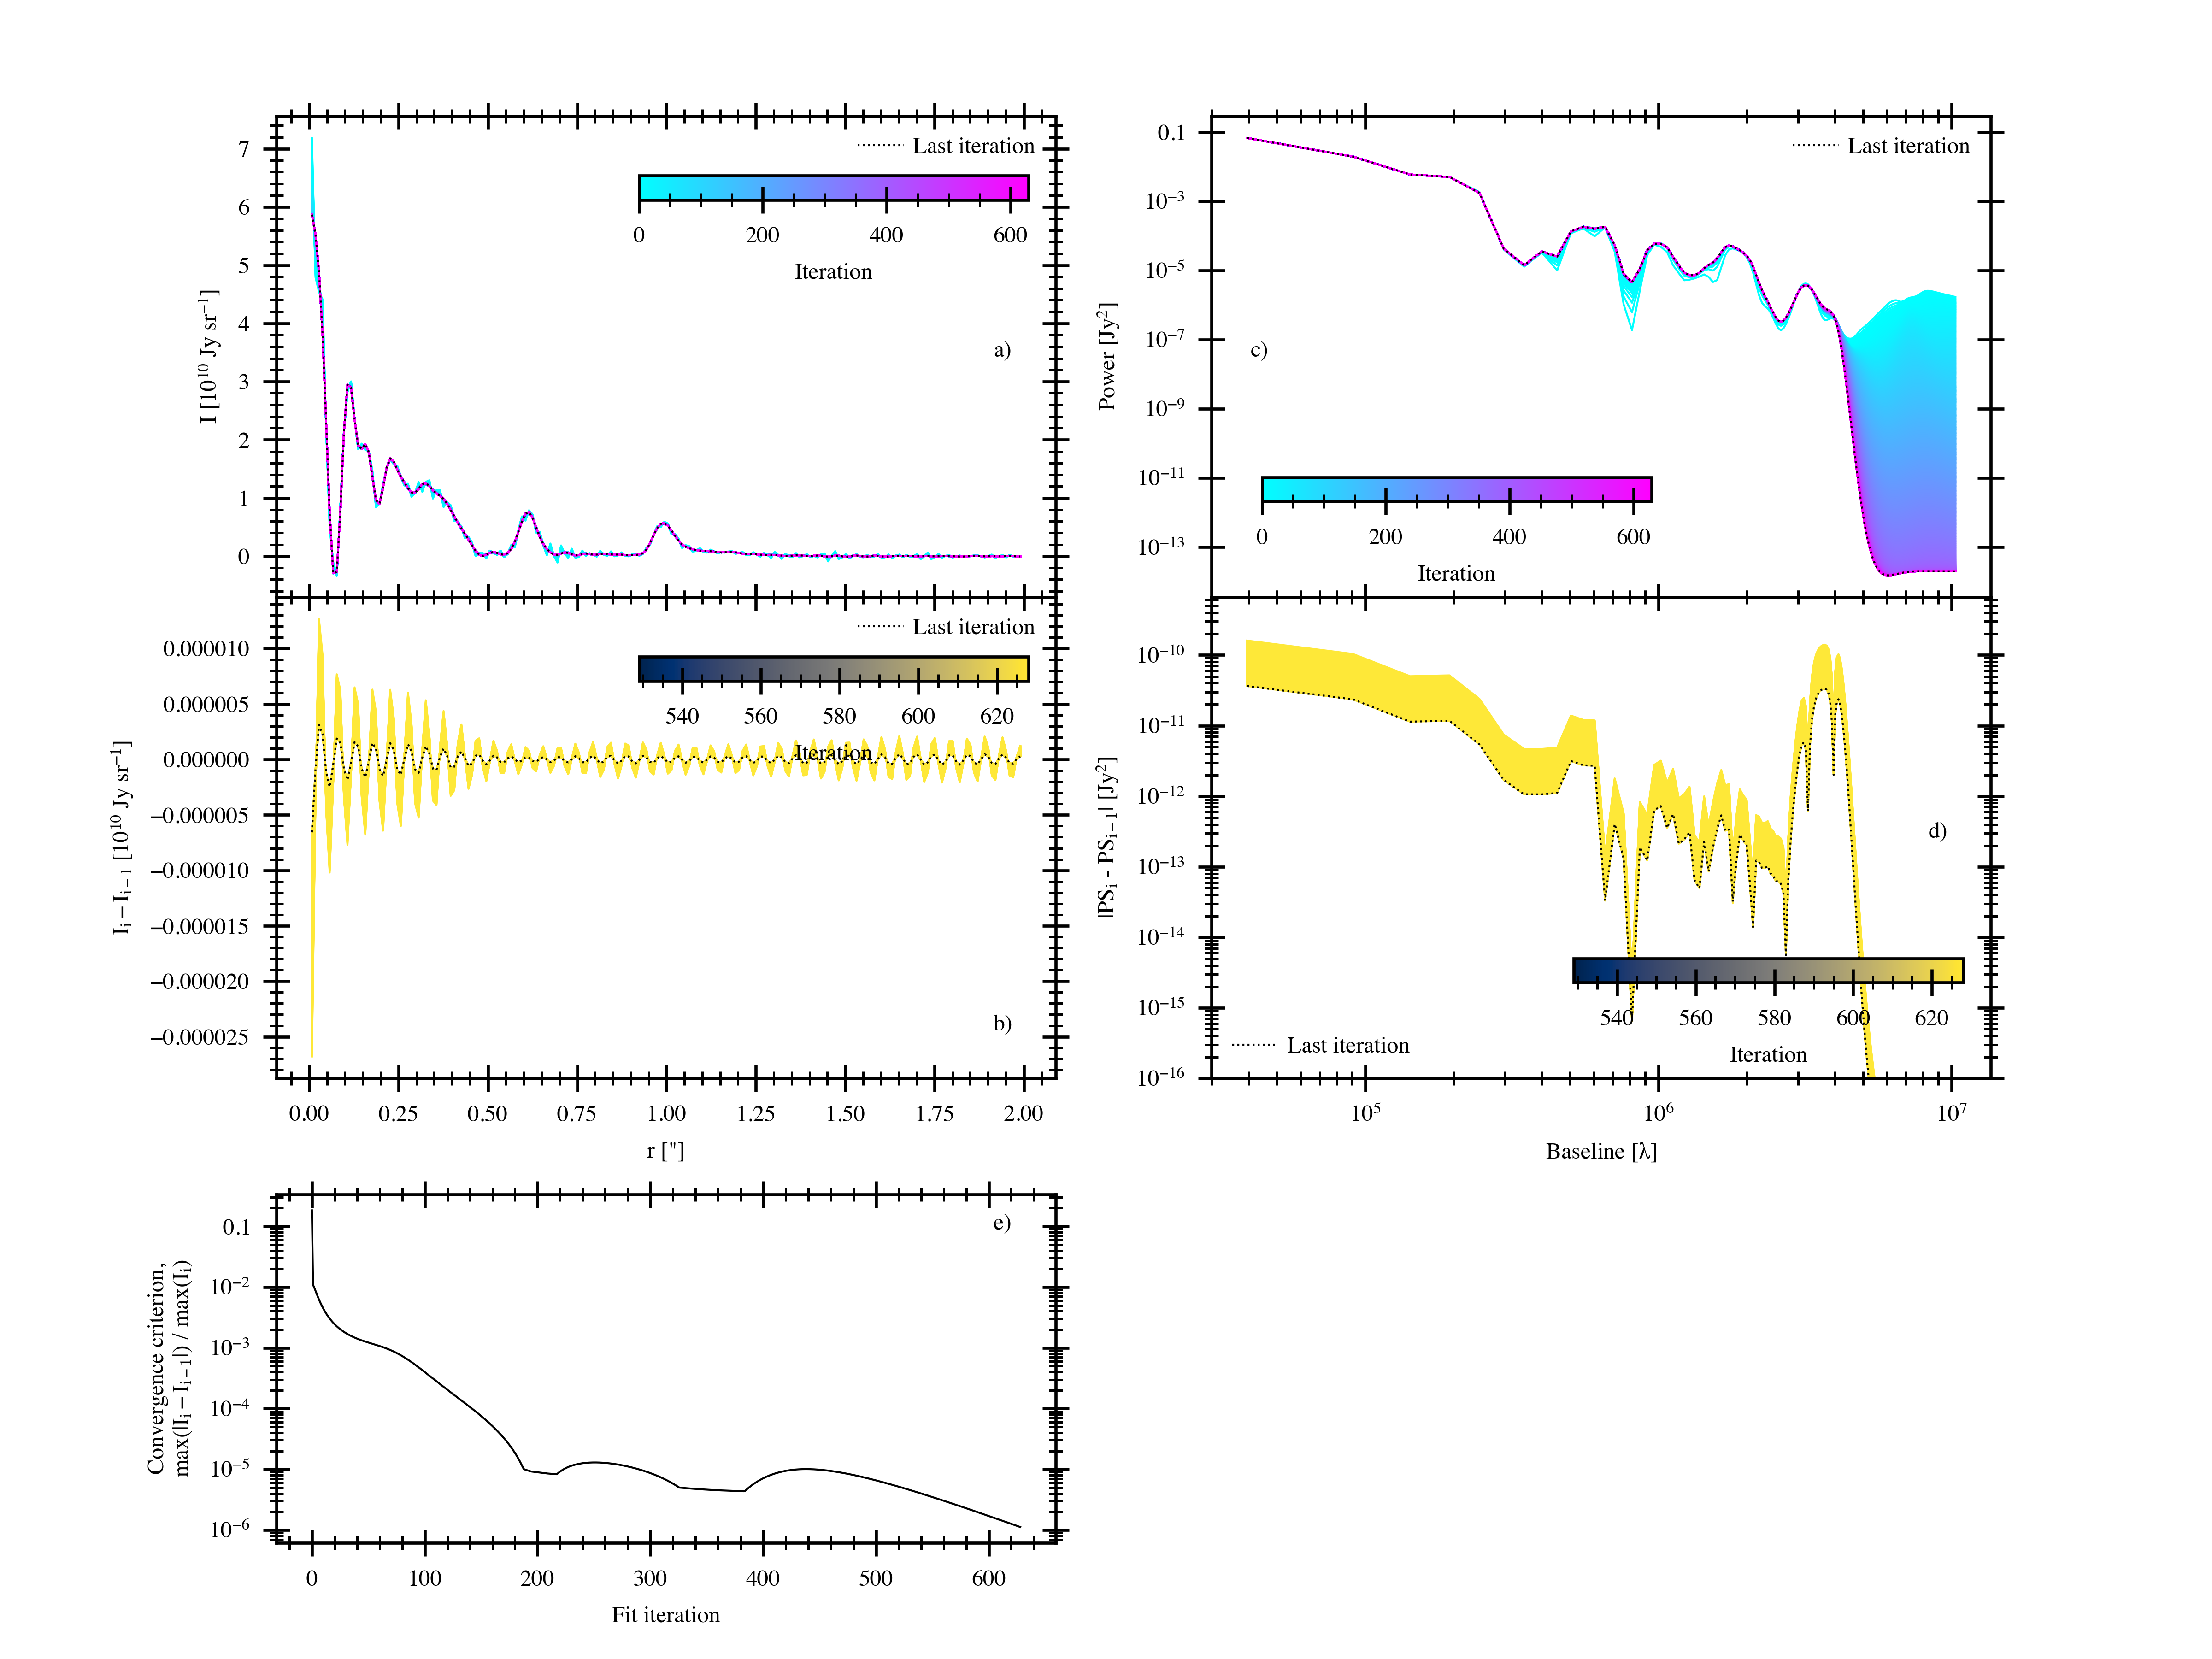
a) The fitted frank brightness profile over all fit iterations.
Note how small amplitude, fast oscillations that are due to unconstrained
baselines are damped over the first \(\approx 100\) iterations.
The fit runs until a convergence criterion on the power spectrum is met at every collocation point,
\(|(P_{\rm i} - P_{\rm i-1}| \leq {\rm tol} * \pi\),
where \(P_{\rm i}\) is the power spectrum at iteration \(i\)
and \({\rm tol}\) is the tolerance (iter_tol) in your parameter file.
This criterion using the power spectrum is more robust than one based on the brightness profile because of the oscillations imposed on the latter by sparse sampling.
If this stopping condition is not met, the fit runs until max_iter as set in your parameter file.
b) Sequential difference between the last 100 brightness profile iterations.
The oscillations remaining at the end of the fit (\(\approx 630\) iterations) are at a couple parts in \(10^5\).
c) The reconstructed power spectrum over all fit iterations.
Our initial guess for the power spectrum, a power law with slope of -2, is apparent in the longest baselines for the first \(\approx 100\) iterations (which depends on the chosen value of \(\alpha\)),
and then we continue iterating to suppress the high power placed at the data’s noisiest, longest baselines.
d) Sequential difference between the last 100 power spectrum iterations.
e) A simple metric for the brightness profile’s convergence, \({\rm max}(|(I_{\rm i} - I_{\rm i-1}|)\ /\ {\rm max}(I_i)\),
where \(I_i\) is the brightness profile at iteration \(i\) and \({\rm max}\) entails the largest value across all collocation points.
In this case the largest variation across all collocation points at the last iteration is thus at a part in \(10^6\) of the profile’s peak brightness.
We always want to ensure this convergence metric isn’t going start increasing again if we iterate for longer.
So in this case we wouldn’t have wanted to stop at iteration \(\approx 380\),
while by iteration \(\approx 500\) the trend looks good.
frank’s internal stopping criterion for the fit, as described in (a), is still not met at iteration 500, though,
because that criterion is conservative to help ensure the power spectrum (and thus the brightness profile) is no longer appreciably changing.